Structural Unemployment in Bulgaria from 2007 onward
The ending 2014 passed under the sign of decreasing unemployment and increasing employment. Although a big portion of the population likely still haven’t felt the benefits of the coming favourable tendencies, it is present not only in the leading economic centres, but also in some of areas lagging behind. At the same time the labour market continues to suffer from significant structural problems, and some of the politics, championed by the new government threaten the speed of its recovery.
The structural characteristics of domestic unemployment is without a doubt one of the main obstructions before an even faster recovery of the labour market. In order to get a better picture of the problem, we will examine te movement of the so called “Beveridge Curve” –one of the main tools for evaluating the efficiency of the labour markets.
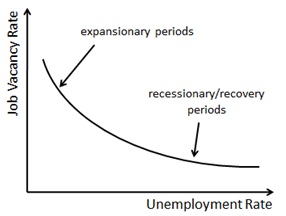
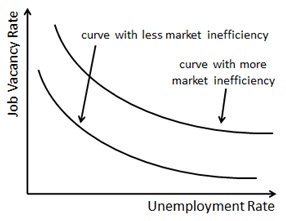
The Beveridge Curve shows the correlation between the unemployment rate and the vacancy rate. During an economic expansion the unemployment rate decreases, and the vacancy rate increases. During a recession the unemployment increases, and the vacancy rate decreases[1]. The position of the curve depends on the efficiency of the labour market. A movement of the curve upwards shows a higher inefficiency of the labour markets, because even though there are more vacanct positions, they are not taken by the unemployed. If the movement of the curve upwards is combined with a movement along the curve towards a higher unemployment, this is a sign of structural problems of the labour market.
Figure 1: Beveridge Curve
The situation here from 2007 until now
The main structural characteristics of the domestic unemployment can be boiled down to:
· Demand of labour is focused on the highly qualified personnel in several specific sectors;
· Demand of unqualified labour remains stagnant or with mainly seasonal character;
· The labour market is characterized by low mobility and serious discrepancies between different regions.
In the time between the first quarter of 2007 and the third quarter of 2014 the movement of the curve for Bulgaria moves through four highly distinct periods. With the goal of maximizing clarity, we are going to go over each of them.
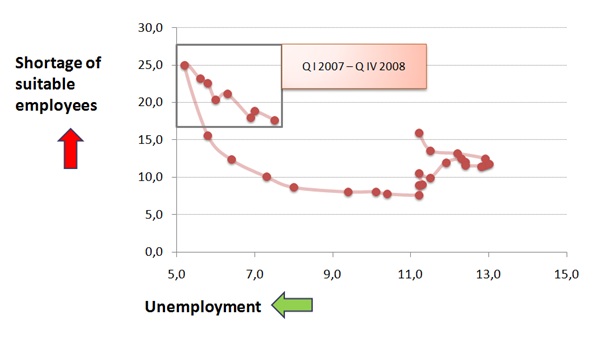
First period (first quarter of 2007 – fourth quarter of 2008): decreasing unemployment and increasing vacancy rate

Source: Eurostat, IME
The discrepancy between the qualification of the job seekers and the needs of the employers is visible even in the years before the crisis. In the period between the first quarter of 2007 and the last quarter of 2008 the share of the companies, that have difficulties finding qualified personnel quickly rises, reaching 25% at the end of 2008. All of this happens while the unemployment is constantly derceasing and means that the growth in employment before the crisis could have been even more impressive, given a suitably educated workforce. In other words, if the companies were able to find the employees they needed, even more Bulgarians would have been employed during that time.
Theoretically, the increasing share of the qualified cadre starved companies is always presend during times of economic expansion, because with lower unemployment and higher employment, the companies compete for fewer potential employees. At the same time reaching a share of 25% shows that the Bulgarian labour market is inherently inefficient, independent of the phase of the economic cycle (i.e. whether the economy is growing or shrinking).
Second period (first quarter of 2009 – fourth quarter of 2010): increasing unemployment and decreasing vacancy rate
Source: Eurostat, IME
2009 passed under the sign of constantly increasing unemployment, combinded with a drastic drop of the share of the companies, that point to the lack of qualified personnel as a factorlimiting increase of production. In 2010 the vacancy rate stabilizes (between 7% and 8%), but unemployment continues to grow. This movement of the Beveridge Curve corresponds to the period of recession, in which firms restrict the labour demand in response to shrinking aggregate demand.
Third period (first quarter of 2011 – last quarter of 2013): increasing unemployment and increasing vacancy rate
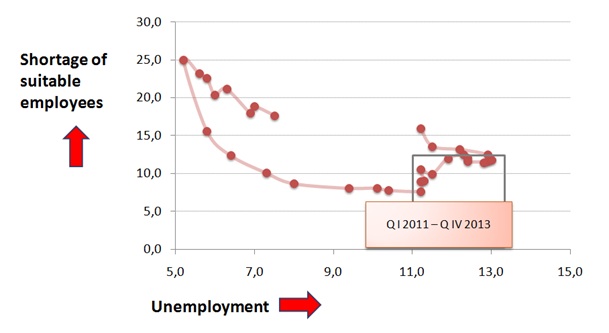
Source: Eurostat, IME
В този тежък за пазара на труда тригодишен период се наблюдава едновременно нарастване и на безработицата, и на дела на фирмите, които определят недостига на подходяща работна ръка като фактор, ограничаващ разширяването на производството. Това е най-ясният знак за покачваща се неефективност на трудовия пазар, тъй като въпреки че е налице нарастващ потенциал за откриване на нови работни места, увеличаващият се брой безработни не е в състояние да ги заеме. Този недвусмислен знак[2] за структурните характеристики на безработицата у нас съпътства целия тригодишен период.
In this hard for the market three year period are observed simultaneous increase of the unemployment and the share of the companies, that classify the lack of qualified personnel as a production-restricting factor. This is the clearest sign of increasing labour market inefficiency, because although an increasing potential for opening new jobs is present, the increasing number of unemployed are not capable to take them. This unambiguous sign1 of the structural characteristics of the domestic unemployment is precent for the entire three year period.
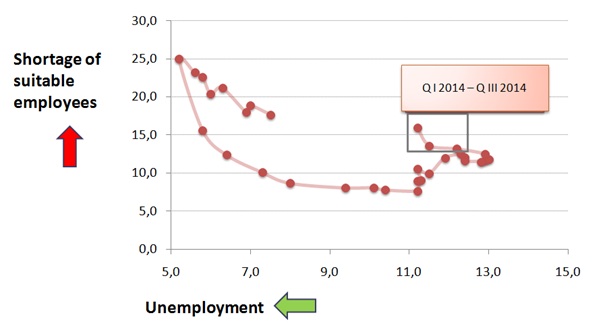
Fourth period (first quarter of 2014 – third quarter of 2014): decreasing unemployment and increasing vacancy rate
Source: Eurostat, IME
Without a doubt the strongest three quarters of the labour market in the recent years lead to a change in the movement of the curve. Since the start of 2014 the unemployment decreases, and the the process is accompanied by increasing share of companies that point to the lack of qualified personnel as a factor, limiting the increase of production. Especially strong is the increase in the second half of the past year, with the vacancy rate in the months of the last quarter[3] has reached almost 20% – the highest in 5 years.
The rapid shift of the curve upwards with still high enemployment shows clearly that structural unemployment is a problem that is becoming ever more serious and is restricting the long term growth potential of the economy.
Some conclusions
In the long term the solution of the structural unemployment problem must include a solition of the clichéd, but real problem of the discrepancy of qualifications of the job seekers and the business needs. At the same time, the labour market in the country continues to be the subject of several government policies that exacerbate the problem, by increasing the stay of the unemployed outside the labour market or altogether cut the access to it for a part of the able-bodied population.
The administrative increase of labour costs is one of these factors. Regardless of whether it is the increase of minimum wage or increasing the employers share of pension payments, these are steps that weigh in on the right side of the „worker skills” – “cost of labour” equation.
This vicious cycle dooms many unemployed to lower chances of finding a job. Keeping in mind the number of firms, that even in high unemployment can’t find qualified employees, the potential for reaching a natural equilibrium on the labour market seems slim. The lack of demand for reform in the labour relations and the designated course towards higher labour costs in the coming years don’t help achieving a higher labour market efficiency. On the contrary, the structural problems are going to continue exacerbating.
[1]The European Commission uses a slightly different approach in approximating the vacant jobs, which is used in this material. In it, the vacancy rate is replaced by another indicator, showing the lack of appropriate for the business goals employees – share of companies, that consider the lack of qualified personnel a factor, limiting production. The data is taken from the quarterly reports of Eurostat amongst business in the EU. The indicator is seasonally adjusted and standardized among member states. More information about the methodology of data collection and the calculation of the indicators is available here.
2Of course, there are other factors present, that influence the movement of the curve. More on the topic you can read here.
3Because of the late publication of the unemployment data, the movement of the curve, reflecting the available data for vacancy rate for the last quarter of 2014 is not reflected on the graph.